Prop Firm Evaluation Metrics vs Broker Performance: Complete Analysis Framework
Understanding Prop Firm Evaluation Metrics
Prop firm evaluation metrics focus on consistency and risk control, while broker performance analysis centers on execution speed and trading conditions. The difference matters for every funded trader.
Prop firms judge traders on specific metrics during evaluation phases. These metrics test your ability to grow capital while protecting against major losses. The evaluation process typically spans 30-60 days with strict performance targets.
The primary evaluation metrics include profit targets, maximum drawdown limits, daily loss restrictions, and trading day requirements. Each metric serves a specific purpose in identifying skilled traders.
Profit targets range from 8% to 12% across major firms. FTMO requires 8% in phase one and 5% in phase two. Apex Trader Funding sets 8% for both phases. These targets test your ability to generate consistent returns.
Maximum drawdown typically caps at 5% from the starting balance. This metric prevents traders from risking too much capital on single trades. The rule stays active throughout the entire evaluation period.
Daily loss limits usually range from 3% to 5% of account value. This stops traders from blowing accounts in single trading sessions. Smart traders never risk more than 1-2% per day to stay well below these limits.
Trading day requirements vary significantly between firms. Some require 10 minimum trading days, others need 15. The rule ensures traders demonstrate consistent activity rather than gambling on a few large positions.
Broker performance analysis examines execution quality, spread competitiveness, and platform reliability. These factors directly impact your trading results and profitability.
Execution speed ranks as the most critical broker metric. Sub-12ms execution speed can mean the difference between profitable scalping and missed opportunities. NextTrade Broker delivers consistent sub-12ms execution regardless of account size.
Spread analysis reveals the true cost of trading. Fixed spreads provide predictability but often cost more during quiet market hours. Variable spreads fluctuate with market conditions but typically offer better pricing during active sessions.
Slippage measurement shows how often your orders fill at intended prices. Quality brokers maintain minimal slippage even during volatile periods. Poor brokers show significant slippage that eats into profits.
Performance Factor
What It Measures
Impact on Trading
Execution Speed
Order processing time
Determines scalping viability
Spread Competitiveness
Cost per trade
Directly affects profitability
Slippage Control
Price deviation on fills
Hidden cost impact
Platform Uptime
System reliability
Trade execution availability
Platform stability becomes crucial during major news events. Server crashes during NFP releases can destroy trading accounts. Quality brokers invest in redundant infrastructure to prevent outages.
Regulatory compliance affects fund security and withdrawal processes. FCA and ASIC regulation provides stronger client protections than offshore licenses. NextTrade Broker maintains segregated client funds with negative balance protection.
Critical Differences in Evaluation Approaches
Prop firms evaluate traders over extended periods while broker analysis focuses on immediate execution quality. This fundamental difference shapes how you should approach each assessment.
Prop firm evaluations span weeks or months. The process tests psychological discipline and consistency under pressure. Firms want traders who can compound capital steadily without major drawdowns.
Broker performance gets measured in milliseconds and basis points. One bad execution can cost hundreds of dollars on large positions. The focus centers on technical capability rather than trading psychology.
Risk management standards differ dramatically between the two models. Prop firms enforce strict daily and total drawdown limits. Brokers typically allow unlimited risk-taking with your own capital.
The data analysis timeframe varies significantly. Prop firm covers 30-90 day evaluation periods. Broker analysis examines tick-by-tick execution data.
Profitability metrics tell different stories. Prop firms care about risk-adjusted returns over time. Brokers focus on cost per trade and execution quality regardless of your trading strategy.
Industry estimates suggest 85% of prop firm applicants fail evaluation phases, while broker selection often depends on 3-5 key technical factors that traders can verify immediately.
Evaluation Timeline Comparison
Prop firm evaluations follow structured phases with specific duration requirements. Phase one typically lasts 30 days with 8-10% profit targets. Phase two extends another 30-60 days with additional consistency requirements.
Broker performance analysis happens in real-time. You can measure execution speed, slippage, and spread quality within the first few trades. Most performance issues become apparent within the first trading week.
The evaluation pressure differs significantly. Prop firms create artificial stress through time limits and drawdown rules. Broker analysis focuses on technical performance during your normal trading activities.
Performance Metrics That Actually Matter
Smart traders focus on metrics that predict long-term success rather than vanity statistics. The most important measurements often get overlooked in favor of flashy numbers.
Win rate receives too much attention from new traders. A 60% win rate with poor risk management loses money fast. Professional traders prioritize risk-reward ratios over win percentages.
Maximum drawdown tells the real story about risk control. Prop firms typically limit drawdown to 5% of account value. Quality brokers help minimize drawdown through superior execution and tight spreads.
Profit factor calculations reveal true edge in trading strategies. Values above 1.5 indicate strong positive expectancy. Values below 1.2 suggest strategy refinement needs.
Recovery time after drawdowns matters more than maximum profits. Traders who bounce back quickly from losses demonstrate strong psychological resilience. Firms prefer steady growers over volatile performers.
Essential Tracking Metrics
Return on maximum risk (RoMaR) measures profit generation relative to maximum position risk. This metric reveals how efficiently you use available capital while staying within risk limits.
Sharpe ratio calculations help compare trading performance across different timeframes and market conditions. Values above 1.0 indicate good risk-adjusted returns for most trading strategies.
Calmar ratio analysis divides annual return by maximum drawdown percentage. This metric specifically appeals to prop firms evaluating trader consistency and risk management skills.
Average trade duration affects both prop firm evaluations and broker selection. Scalpers need ultra-fast execution while swing traders prioritize overnight financing costs and weekend gaps.
Tools and Platforms for Performance Tracking
Professional traders use specialized tools to track both prop firm compliance and broker performance metrics. The right software saves time and prevents costly evaluation failures.
TradesViz offers comprehensive analytics for funded account tracking. The platform calculates drawdown metrics, risk ratios, and compliance status in real-time. Most prop firms accept TradesViz reports as official documentation.
MyFxBook provides free performance tracking with detailed statistics. The service connects to most trading platforms and generates professional-looking reports. However, the free version lacks advanced risk management features.
FXBlue offers detailed trade analysis with focus on broker execution quality. The platform measures slippage, execution speed, and spread variations across different trading sessions. This data helps optimize broker selection.
Platform
Best For
Key Features
Cost
TradesViz
Prop firm compliance
Drawdown tracking, risk metrics
$29/month
MyFxBook
Basic performance tracking
Free reports, social trading
Free/Premium
FXBlue
Execution analysis
Slippage measurement, spreads
Free
TradingView
Strategy backtesting
Pine Script, market data
$14-59/month
MetaTrader platforms include basic performance tracking through the History tab. The built-in reports show profit/loss, drawdown periods, and win rates. However, the data lacks advanced risk metrics required by most prop firms.
Custom Excel spreadsheets work for simple tracking needs. Many traders build personalized dashboards using trading platform APIs. This approach requires technical skills but offers complete customization.
Automation and Real-Time Monitoring
Automated monitoring prevents rule violations during active trading. Smart traders set up alerts for daily loss limits, total drawdown thresholds, and minimum trading day requirements.
Risk management EAs (Expert Advisors) can automatically close positions when drawdown limits approach. These tools work particularly well for prop firm evaluations where rule violations mean instant failure.
Real-time performance dashboards help track progress toward profit targets. Visual indicators show how much buffer remains before hitting maximum drawdown or daily loss limits.
Common Evaluation Mistakes to Avoid
Most prop firm failures result from preventable mistakes rather than trading skill deficits. Understanding these pitfalls helps improve evaluation success rates significantly.
Overtrading during evaluation periods destroys more accounts than poor strategy selection. Nervous traders often increase position sizes or trade frequency when behind on targets. This behavior typically leads to rule violations.
Ignoring daily loss limits causes instant failure at most firms. Some traders assume they can recover losses the next day. The reality is that daily limits reset at midnight GMT regardless of your time zone.
Poor broker choice impacts evaluation success through execution issues. Slow fills and wide spreads make it harder to achieve profit targets within drawdown limits. Quality execution becomes essential for tight risk management.
Emotional trading increases during evaluation pressure. The artificial time constraints and profit requirements create stress that affects decision-making. Successful candidates stick to proven strategies regardless of pressure.
Calendar neglect leads to missed minimum trading day requirements. Some firms require trades on at least 10 different calendar days. Vacation breaks or illness can cause evaluation failures if not planned properly.
Risk Management Protocol
Position sizing should never exceed 1% risk per trade during evaluations. This conservative approach provides safety margin below the typical 3-5% daily loss limits imposed by most firms.
Stop loss placement requires extra consideration during volatile sessions. News events can trigger slippage that pushes losses beyond intended levels. Smart traders avoid trading major announcements during evaluations.
Correlation analysis prevents overexposure to similar currency pairs. Trading EUR/USD and GBP/USD simultaneously doubles exposure to USD movements. Diversification helps control overall account risk.
Choosing Between Prop Firms and Direct Broker Trading
The choice between funded trading and direct broker access depends on your capital situation, risk tolerance, and trading style preferences. Each path offers distinct advantages for different trader profiles.
Prop firm funding provides capital access without personal financial risk. Evaluation fees typically range from $100 to $600 depending on account size. Successful traders can scale to six-figure accounts relatively quickly.
Direct broker trading offers unlimited risk-taking and complete strategy freedom. You keep 100% of profits but risk your own capital. This path suits traders with substantial personal funds and proven track records.
shows how different approaches serve various trader needs and capital levels.
Capital Requirements and Scaling
Prop firms typically require $100-600 evaluation fees to access $10,000-200,000 in trading capital. The leverage on evaluation fees can reach 100:1 or higher for successful traders.
Direct broker trading requires your own capital plus margin requirements. Most retail brokers offer 30:1 to 100:1 leverage on major currency pairs. Your scaling depends entirely on personal wealth accumulation.
The breakeven calculation differs significantly. Prop firm traders need to cover evaluation costs plus profit splits. Direct traders only need to cover spread costs and any financing charges.
Strategy Limitations and Freedom
Prop firms often restrict high-frequency trading, news trading, and exotic pairs. Most firms prefer swing trading or position trading strategies that demonstrate consistent risk management.
Broker trading allows complete strategy freedom including scalping, news trading, and algorithmic approaches. The only limitations come from platform capabilities and market liquidity.
Holding period restrictions vary by firm. Some prop firms limit overnight positions or weekend holds. Direct trading through quality brokers imposes no artificial time constraints.
Advanced Performance Analysis Techniques
Professional traders use sophisticated analysis methods to optimize both prop firm success and broker selection decisions. These techniques go beyond basic profit/loss tracking.
Monte Carlo simulation helps predict evaluation success probabilities. By running thousands of scenarios with your historical trading data, you can estimate pass rates under different market conditions.
Regression analysis identifies which trading conditions produce your best performance. This data helps optimize trading schedules and market selection for both evaluations and live trading.
Heat map analysis reveals performance patterns across different trading sessions, days of week, and market conditions. Visual representation makes it easier to spot profitable timing patterns.
Statistical Validation Methods
Bootstrap sampling techniques validate strategy robustness across different market periods. This method helps distinguish between skill and luck in trading performance.
Sharpe ratio confidence intervals provide better understanding of risk-adjusted return stability. Wide confidence intervals suggest inconsistent performance that might fail prop firm evaluations.
Drawdown duration analysis predicts recovery times from losing streaks. Prop firms prefer traders who demonstrate quick recovery patterns rather than extended losing periods.
Correlation analysis between your trades and market volatility helps predict performance during different market regimes. High correlation suggests vulnerability during unusual market conditions.
Technology Impact on Performance Measurement
Modern trading technology enables more precise performance measurement than ever before. Cloud-based analytics and real-time data processing provide insights that were impossible just years ago.
API connectivity allows seamless data flow between trading platforms and analysis software. This automation eliminates manual data entry errors and provides real-time performance updates.
Machine learning algorithms can identify patterns in trading behavior that predict future performance. These tools help both traders and prop firms make better evaluation decisions.
Blockchain technology enables immutable performance records that prevent data manipulation. Some prop firms now use blockchain-verified trading histories for evaluation purposes.
Real-Time Risk Monitoring
WebSocket connections provide millisecond-level position monitoring for both prop firm compliance and broker performance analysis. This technology enables instant alerts for rule violations or execution issues.
Cloud computing allows complex risk calculations that update continuously during active trading. Traders can monitor dozens of risk metrics simultaneously without impacting platform performance.
Mobile technology keeps traders connected to performance metrics regardless of location. Push notifications for risk limit approaches help prevent evaluation failures during travel.
Maximum drawdown control ranks as the most critical metric. Based on typical industry standards, most firms set 5% limits, and violations typically cause instant failure regardless of profit performance. Smart traders never risk more than 1-2% per trade to maintain safety margins.
Track three key metrics: execution speed (aim for under 20ms), slippage percentage (should be minimal during normal hours), and spread stability during volatile periods. Test execution during major news events when performance matters most.
TradesViz offers the most comprehensive prop firm compliance tracking with real-time drawdown monitoring and risk calculations. MyFxBook provides good basic tracking for free, while FXBlue excels at broker execution analysis.
Choose prop firms if you have limited capital (under $10,000) but proven trading skills. Direct broker trading works better for traders with substantial personal funds who want complete strategy freedom and 100% profit retention.
Industry estimates suggest overtrading and poor risk management cause 80% of failures. Traders often increase position sizes when behind on targets or ignore daily loss limits. Stick to conservative risk levels and proven strategies during evaluations.
Review key metrics weekly during normal trading and daily during prop firm evaluations. Monthly deep analysis helps identify longer-term patterns and strategy optimization opportunities. Real-time monitoring prevents rule violations.
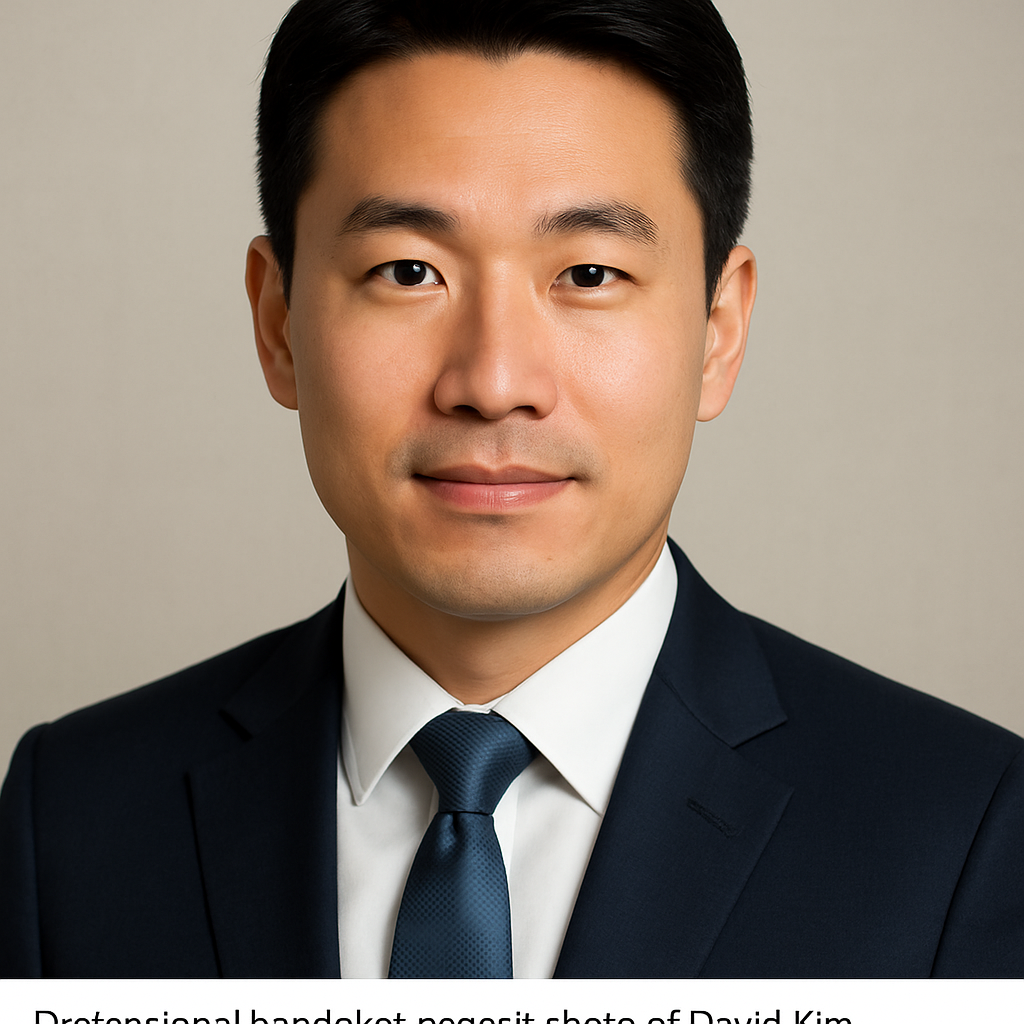
David Kim brings 15 years of institutional forex analysis experience to retail and prop trading evaluation. His data-driven approach to broker comparison and market structure analysis provides traders with the quantitative insights needed for informed platform and strategy decisions.