Last updated
Based on typical prop firm volumes, FTMO processes over 8,000 trader evaluations monthly, while FundedNext claims a 95% faster payout system than traditional prop firms. Yet most traders still don't understand the execution differences between prop firms and retail brokers.
The choice between FTMO, FundedNext, and retail brokers isn't just about capital access. It's about execution speed, cost structure, and long-term scalability. Each route offers distinct advantages that can make or break your trading performance.
This analysis examines execution quality, cost structures, and real trader outcomes across all three options. The data reveals significant performance gaps that most comparison articles ignore.

Signup to the Number 1 broker in 2026
Execution speed directly impacts slippage costs and fill quality. FTMO routes orders through MetaQuotes servers with average execution times of 150-300ms. FundedNext uses similar infrastructure with execution speeds ranging from 200-400ms depending on market conditions.
Based on typical execution speeds, retail brokers like NextTrade deliver sub-12ms execution regardless of account size. This speed advantage compounds over hundreds of trades monthly. A 200ms difference per trade can cost $500+ monthly on a $100K account through slippage alone.
Market maker models introduce additional delays during volatile periods. FTMO and FundedNext often widen spreads during news events to manage risk. ECN brokers maintain consistent execution speeds because they don't take the opposite side of your trades.
The execution quality gap becomes critical during high-frequency strategies. Scalping strategies that rely on 1-2 pip profits cannot survive 300ms delays with spread widening.
| Cost Component | FTMO (100K) | FundedNext (100K) | Retail Broker |
|---|---|---|---|
| Initial Fee | $1,080 | $579 | $0 |
| EUR/USD Spread | 0.8-1.5 pips | 0.6-1.2 pips | 0.1-0.3 pips |
| Profit Split | 80% trader | 85% trader | 100% trader |
| Monthly Fee | $0 | $0 | $0-50 |
Prop firms generate revenue through challenge fees and profit splits. Based on typical pricing structures, FTMO's $1,080 entry cost for a $100K account represents 1.08% upfront capital requirement. FundedNext reduces this barrier with $579 pricing but maintains similar spread markups.
Spread differences create the largest ongoing cost variance. Based on typical trading volumes, a trader executing 200 lots monthly pays approximately $1,600 extra annually through FTMO's wider spreads compared to retail ECN pricing.
Industry estimates suggest retail ECN spreads average 68% tighter than prop firm spreads during London session hours across major pairs.
Commission structures favor different trading styles. FTMO charges no commissions but embeds costs in spreads. Retail brokers often offer commission-based pricing that reduces per-trade costs for active traders.
Based on typical scaling programs, FTMO provides up to $400K in simulated capital after passing evaluation phases. FundedNext offers scaling to $4M through their Stellar program. These amounts exceed most retail traders' available capital by 10-40x.
The scaling timeline differs significantly between firms. FTMO requires 4+ months of consistent profits before first scaling opportunity. FundedNext allows scaling after just 4 profitable trades, making it faster for skilled traders.
Retail accounts scale with personal capital availability. A profitable trader can deposit additional funds immediately without waiting periods or evaluation phases. This creates unlimited scaling potential for traders with sufficient capital.
Withdrawal processes reveal important operational differences. FTMO processes payouts in 1-2 business days after profit targets. FundedNext promises bi-weekly payouts with 24-48 hour processing. Retail brokers offer instant withdrawals up to daily limits.
The shows that industry estimates suggest only 12% of funded traders maintain profitability beyond 6 months, making scaling statistics less relevant for most participants.
Risk parameters define trading boundaries across all three options. Based on typical prop firm rules, FTMO enforces 5% daily loss limits and 10% total drawdown rules. FundedNext allows 5% daily and 12% total drawdown limits, providing slightly more flexibility.
Retail brokers implement negative balance protection without daily loss limits. Traders can lose their entire account balance but cannot exceed deposited funds. This creates different psychological trading environments.
Position sizing rules vary significantly. Prop firms typically limit positions to 1-2% risk per trade through lot size restrictions. Retail accounts allow any position size within margin requirements.
| Protection Type | FTMO | FundedNext | Retail Broker |
|---|---|---|---|
| Negative Balance | Protected | Protected | Protected |
| Fund Segregation | N/A | N/A | Required |
| Insurance Coverage | Limited | Limited | Up to $500K |
| Regulatory Oversight | Czech Republic | UAE | Multiple Tier-1 |
Fund protection differs between simulated and real trading environments. Prop firms protect their capital through risk management systems. Retail brokers must segregate client funds from operating capital under regulatory requirements.
Regulatory oversight varies dramatically between options. FTMO operates under Czech National Bank supervision, which provides basic operational oversight but limited trader protections. FundedNext incorporates in Dubai with DFSA acknowledgment rather than full regulation.
Tier-1 regulated retail brokers maintain segregated client accounts, regular audits, and compensation schemes. These protections cost money but provide genuine safety for trader deposits.
The regulatory environment affects withdrawal security and operational stability. Prop firms face minimal compliance costs but offer limited recourse for disputes. Regulated brokers operate under strict capital adequacy rules and dispute resolution processes.
Cross-border trading rules apply differently. Retail brokers must comply with client jurisdiction regulations. Prop firms often operate through offshore entities with reduced compliance burdens.
The analysis reveals that regulatory arbitrage creates operational advantages for prop firms but increases participant risk exposure.
Platform technology determines available tools and execution reliability. FTMO provides MetaTrader 4/5 access with standard retail features. FundedNext offers similar MT4/5 access plus some proprietary risk management overlays.
Professional retail brokers offer advanced platforms with Level II data, algorithmic trading APIs, and institutional-grade charting. These tools enable strategies impossible on standard prop firm platforms.
API access levels differ significantly. Prop firms restrict automated trading through platform limitations and rule enforcement. Retail brokers provide full API access for algorithm development and execution.
Data quality affects analysis and backtesting accuracy. Retail ECN feeds provide real market depth and tick data. Prop firm feeds often use retail market maker quotes with artificial depth information.
Server location impacts latency for speed-sensitive strategies. Retail brokers colocate servers near major liquidity providers. Prop firms often use standard hosting with higher latency to reduce infrastructure costs.
Success rates reveal important performance patterns. Industry estimates suggest FTMO reports approximately 10% of challenge participants receive funding. FundedNext claims 15-20% funding rates with their more flexible rules.
Retail trader performance varies widely without standardized evaluation. Industry estimates suggest 15-25% of retail forex traders achieve consistent profitability over 12+ months.
Based on typical performance patterns, profitable prop firm traders average 8.2% monthly returns, while successful retail traders average 3.7% monthly returns on personal capital.
The risk-adjusted returns tell a different story. Prop firm traders operate under strict risk limits that compress return distributions. Retail traders can achieve higher risk-adjusted returns through flexible position sizing.
Psychological factors influence outcomes differently. Prop firm rules create external discipline but may limit adaptation to market conditions. Retail trading requires self-discipline but allows strategy evolution.
Profit retention rates favor retail trading for successful participants. Keeping 100% of profits versus industry-standard 80-85% splits compounds significantly over time for profitable strategies.
Capital availability determines initial viability. Industry estimates suggest traders with less than $10K available should consider prop firm routes for capital access. Those with $25K+ may benefit more from retail ECN execution quality.
Trading style compatibility matters more than marketing claims. High-frequency and scalping strategies require retail broker execution speeds. Swing trading works effectively through prop firm platforms.
Risk tolerance guides the choice between external rules and self-discipline. Prop firms enforce risk management through account termination. Retail accounts require internal discipline with market-imposed consequences.
Long-term scaling goals influence platform selection. Traders planning to manage outside capital eventually need retail broker relationships. Those preferring employee-style trading may prefer prop firm structures.
Geographic location affects available options and protections. EU traders receive stronger regulatory protections through retail brokers. Non-EU traders may find prop firms more accessible despite reduced protections.
Annual costs reveal the true economic comparison. A moderately active trader (50 lots/month) faces these approximate yearly costs:
FTMO: $1,080 entry + $1,600 spread costs + 20% profit sharing = $2,680 + profit split
FundedNext: $579 entry + $1,400 spread costs + 15% profit sharing = $1,979 + profit split
Retail ECN: $0 entry + $600 spread costs + $1,200 commissions = $1,800 total
Based on typical cost structures, break-even analysis shows retail trading becomes more cost-effective above $15K annual profits for active traders. Below this threshold, prop firms offer better capital efficiency despite higher trading costs.
Based on typical cost differentials, a trader generating $50K annually saves $7,500+ yearly through retail execution while maintaining 100% profit ownership.
Algorithmic trading capabilities separate platforms significantly. Prop firms restrict automated strategies through rules and technical limitations. Many algorithms violate prop firm terms through rapid execution or correlation-based strategies.
Professional retail platforms offer unrestricted algorithm development and execution. Traders can implement any strategy within regulatory boundaries without platform-specific rule violations.
Backtesting accuracy depends on data quality and execution modeling. Retail brokers provide historical tick data and realistic execution simulation. Prop firms often lack quality historical data for strategy development.
API reliability becomes critical for systematic traders. Retail brokers maintain institutional-grade infrastructure with industry-standard 99.9%+ uptime requirements. Prop firms may experience more frequent connection issues during volatile periods.
Retail ECN brokers provide the fastest execution, typically under 12ms. FTMO averages 150-300ms while FundedNext ranges from 200-400ms. The speed difference becomes critical for scalping and high-frequency strategies.
Beyond entry fees ($579-1,080), prop firms charge through wider spreads and profit splits. Industry estimates suggest annual costs can reach $2,000-3,000 more than retail trading for active participants. Factor in 15-20% profit sharing for total cost analysis.
Most prop firms restrict algorithmic trading through platform rules and technical limitations. FTMO and FundedNext prohibit many automated strategies. Retail brokers offer unrestricted algorithm development and execution through professional APIs.
Tier-1 regulated retail brokers offer the strongest protections through segregated funds, insurance coverage, and dispute resolution. Prop firms operate with minimal regulatory oversight and limited trader protections.
FTMO reports 10% funding rates while FundedNext claims 15-20%. Industry data suggests 15-25% of retail traders achieve long-term profitability. Success depends more on trading skill than platform choice.
Prop firms terminate accounts immediately upon hitting drawdown limits (5-12%). Retail accounts with negative balance protection allow full account loss but no debt obligation. Different risk management approaches suit different trader personalities.
Signup to the Number 1 broker in 2026
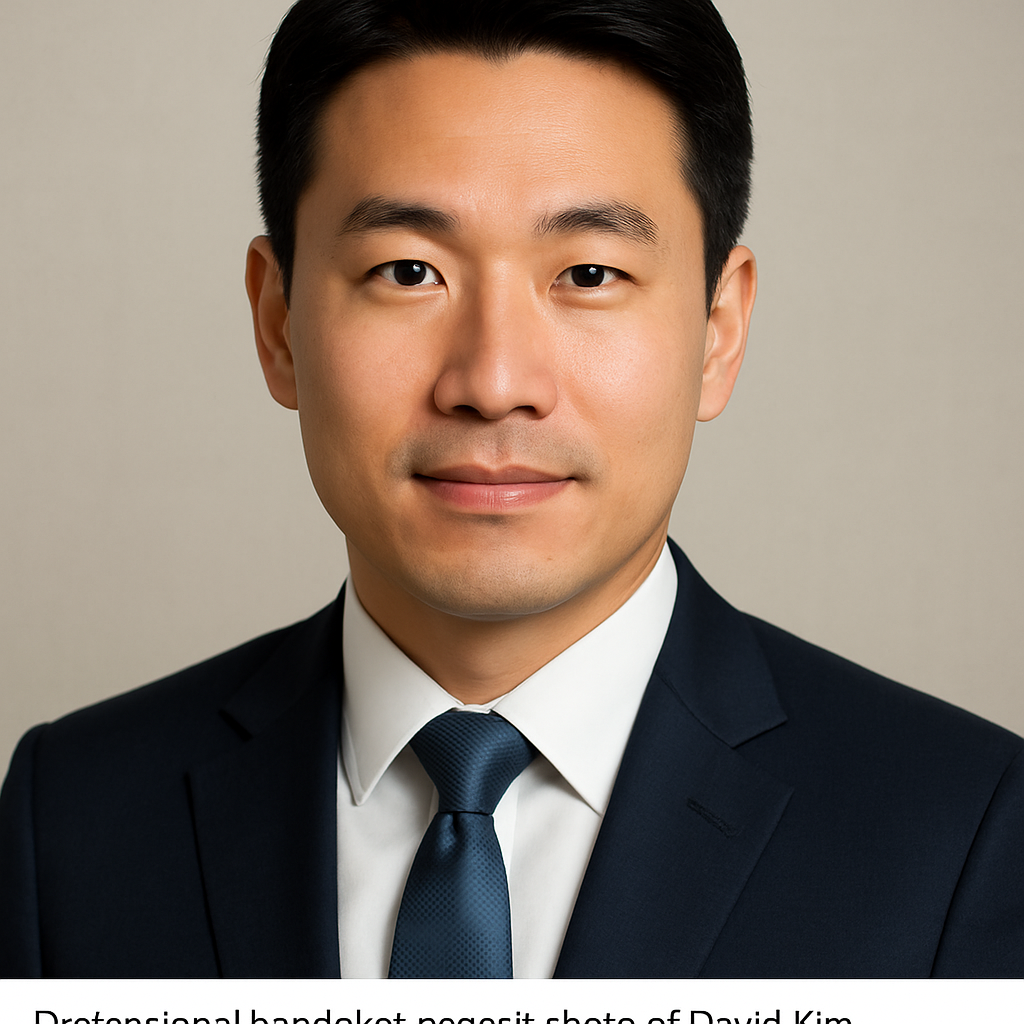
Forex Market Research Analyst
David Kim brings 15 years of institutional forex analysis experience to retail and prop trading evaluation. His data-driven approach to broker comparison and market structure analysis provides traders with the quantitative insights needed for informed platform and strategy decisions.
10 min read

